Where to find obsidian colors at Glass Buttes
by Andy Zeigert
6 min read
One thing I'd like to do with this blog is share mapping projects.
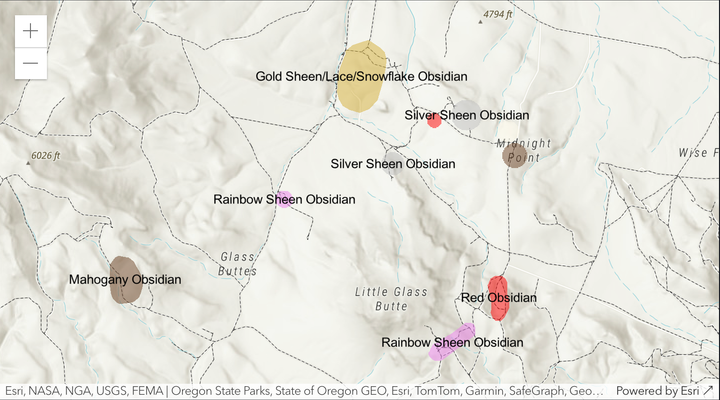
Below is a simple map I made using the ArcGIS JavaScript API. It's a map of the Glass Buttes area southeast of Bend that shows where one might find the shades of obsidian that are available there.
About Glass Buttes
Glass Buttes is a small group of buttes located about an hour drive southeast of Bend, Oregon. It doesn't look like much from the road, but look closer and you'll find a treasure trove of remarkable views, easy rockhounding, and interesting history. I can't really summarize the cultural importance better than the wikipedia page:
For thousands of years, Native Americans used obsidian for making cutting tools, arrowheads, and spear points. Obsidian was also an important trade good for Native Americans. Glass Buttes obsidian was used for these purposes at least 9000 years ago. Clovis people may have also collected obsidian at Glass Buttes up to 13,000 years ago. Glass Buttes obsidian has been found at sites throughout the Pacific Northwest, from British Columbia in the north to California in the south and as far east as Idaho. Some reports place Glass Buttes obsidian artifacts at archeological sites as far east as Ohio.
People have been coming here for 13,000 years! You can go there and legally collect obsidian, which you can't do on most public lands.
How I added this map to a Lume post
Each post in my Lume project is generated from a Markdown file. Since ordinary HTML can be included inline in any Markdown file, it is easy to accomplish. I added the following markup after the introductory paragraphs:
<!-- Note the 'nofeed' class applied to elements related to the interactive map. This tells my instance of loom to remove these elements from generated feeds. -->

<!-- Div that the map will eventually be rendered in -->
<div id="viewDiv" class='nofeed' style="height: 300px"></div>

<!-- Link to external css dependency -->
<link rel="stylesheet" class='nofeed' href="https://js.arcgis.com/4.28/@arcgis/core/assets/esri/themes/light/main.css">

<!-- Module script element -->
<script class='nofeed' type="module">
    // javascript that creates the map, see below
</script>

<!-- Fallback image for feed -->
<img class="feedonly" id="viewDivFallback" loading="lazy" src='/img/glass-buttes-fallback.jpg' alt='Screenshot of the Glass Buttes map'>
Lume generates the necessary HTML from the Markdown and simply drops in the added HTML. The script tag includes references to CSS and JavaScript hosted on an external CDN, so no additional files are necessary.
If you're curious, this map is created using the ArcGIS JS API. The block below contains all the code used. I've used module syntax so that I can import dependencies from elsewhere without having to include them using additional script tags.
import config from 'https://js.arcgis.com/4.28/@arcgis/core/config.js'
import Map from 'https://js.arcgis.com/4.28/@arcgis/core/Map.js';
import MapView from 'https://js.arcgis.com/4.28/@arcgis/core/views/MapView.js';
import FeatureLayer from 'https://js.arcgis.com/4.28/@arcgis/core/layers/FeatureLayer.js';
import SimpleRenderer from 'https://js.arcgis.com/4.28/@arcgis/core/renderers/SimpleRenderer.js';
import SimpleFillSymbol from 'https://js.arcgis.com/4.28/@arcgis/core/symbols/SimpleFillSymbol.js';

config.apiKey = "AAPK86784ca30aa14d049a6f9738ad5242bdDlVV9sW1lHnv91iRyQ2z-BevguH-N6EE0rVZDLfL08h6fxsQPgNFMgviM1v4g5IL";

const map = new Map({
	basemap: "arcgis-topographic" // Basemap layer service
});

const view = new MapView({
	map: map,
	center: [-120, 43.54], // Longitude, latitude
	zoom: 12, // Zoom level
	container: "viewDiv" // Div element
});

const roadLayer = new FeatureLayer({
	url: "https://services1.arcgis.com/KbxwQRRfWyEYLgp4/ArcGIS/rest/services/BLM_OR_Ground_Transportation_GTRN_Roads_Line_Hub/FeatureServer"
});

const colorMap = {
	"Rainbow Sheen Obsidian": "rgba(0,76,115,1)",
	"Mahogany Obsidian": "rgba(0,76,115,1)",
	"Red Obsidian": "rgba(0,76,115,1)",
	"Gold Sheen/Lace/Snowflake Obsidian": "rgba(0,76,115,1)",
	"Silver Sheen Obsidian": "rgba(0,76,115,1)",
	"Lace Obsidian": "rgba(0,76,115,1)"
}

let obsidianRenderer = {
	type: "unique-value",
	field: "REC_NAME",
	defaultSymbol: { type: "simple-fill", outline: null },
	uniqueValueInfos: [
		{
			value: "Rainbow Sheen Obsidian",
			symbol: {
				type: "simple-fill",
				color: "rgba(238, 130, 238, 0.5)",
				outline: null
			}
		},
		{
			value: "Mahogany Obsidian",
			symbol: {
				type: "simple-fill",
				color: "rgba(108, 67, 36, 0.5)",
				outline: null
			}
		},
		{
			value: "Red Obsidian",
			symbol: {
				type: "simple-fill",
				color: "rgba(255, 0, 0, 0.5)",
				outline: null
			}
		},
		{
			value: "Gold Sheen/Lace/Snowflake Obsidian",
			symbol: {
				type: "simple-fill",
				color: "rgba(212, 175, 55, 0.5)",
				outline: null
			}
		},
		{
			value: "Silver Sheen Obsidian",
			symbol: {
				type: "simple-fill",
				color: "rgba(192, 192, 192, 0.5)",
				outline: null
			}
		},
		{
			value: "Lace Obsidian",
			symbol: {
				type: "simple-fill",
				color: "rgba(254, 251, 234, 0.5)",
				outline: null
			}
		},
	]
}

const recBounds = new FeatureLayer({
	url: "https://services1.arcgis.com/NPDrPpMk7Wd8mOGL/arcgis/rest/services/BLM_Recreation_Boundaries/FeatureServer",
	renderer: obsidianRenderer,
	// renderer: new SimpleRenderer({
	// 	symbol: new SimpleFillSymbol({
	// 		color: "rgba(0,76,115,0.5)",
	// 		outline: null
	// 	})
	// }),
	definitionExpression: "OBJECTID < 452",
	labelingInfo: {
		symbol: {
			type: "text",
			color: "black",
			font: {  // autocast as new Font()
				// family: "Playfair Display",
				size: 10,
				// weight: "bold"
			},
		},
		labelPlacement: "above-right",
		labelExpressionInfo: {
			expression: "$feature.REC_NAME"
		}
	}
});

map.add(roadLayer);
map.add(recBounds);
This post mostly started out as practice embedding javascript in a Lume post. I conclude that this setup, even though it involves a build step, uses the best of both worlds: I can write the majority of the body of the post in Markdown, drop in HTML as needed, and Lume generates a nice static page with minimal javascript overhead.
Additionally, I'm excited to have a place to post mapping projects that I've worked on over the years!
P.S. This map was originally made on CodePen, feel free to fork it there.
P.P.S. I'm testing out the Mastodon comment integration, see below.
P.P.P.S. When I view this post in NetNewsWire, the map div gets extremely weird. I'm working on it.
UPDATE 2024-01-08: Thanks to some quick work from Óscar Otero, the creator of Lume and maintainer of theme-simple-blog, the RSS feed should now show a fallback image in place of unsupported content.